
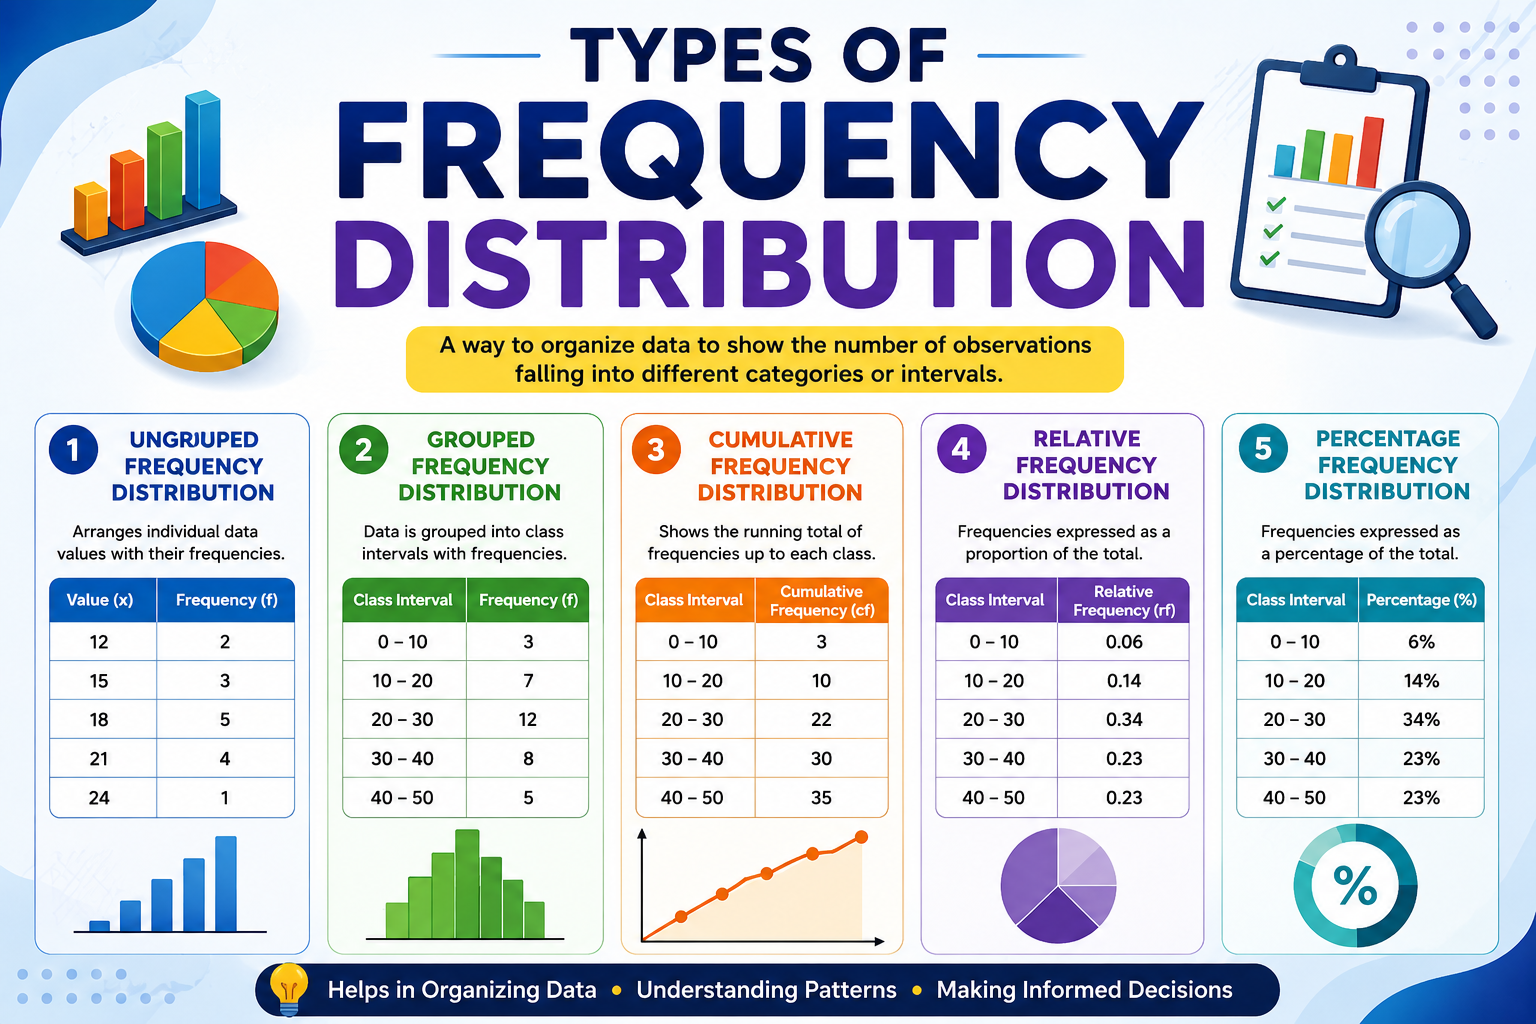
Type of Frequency Distribution
- A frequency distribution summarizes how often different values occur in a dataset.
- It can be presented as a table or graph, such as a histogram, bar graph, or pie chart.
- Depending on the nature of the data, different types of frequency distributions are used to capture and analyze data effectively.
Advertisements
Main Types of Frequency Distributions:
-
- Discrete Frequency Distribution
- Continuous Frequency Distribution
- Cumulative Frequency Distribution
-
Discrete Frequency Distribution
- Used for categorical or countable data, where the values are distinct and separate (e.g., number of students, cars, books).
- Typically applied to whole numbers or non-divisible units.
- Example: Number of Books Read by Students in a Month
- A survey of 20 students recorded how many books each student read in the past month. The data:
- 0, 1, 2, 1, 3, 2, 0, 1, 4, 2, 0, 1, 3, 2, 0, 1, 4, 2, 0, 1
| Number of Books | Frequency |
| 0 | 5 |
| 1 | 6 |
| 2 | 5 |
| 3 | 2 |
| 4 | 2 |
- This table shows a discrete frequency distribution for the number of books read.
Advertisements
-
Continuous Frequency Distribution
- Used for measurable data that can take any value within a given range.
- The data is grouped into intervals, as individual values may vary continuously and infinitely.
Advertisements
- Example: Heights of 20 People
- Height measurements of 20 individuals were grouped as follows:
| Height Range (cm) | Frequency |
| 150–159 | 2 |
| 160–169 | 6 |
| 170–179 | 7 |
| 180–189 | 4 |
| 190–199 | 1 |
- This table represents a continuous frequency distribution of height, grouped into class intervals.
Advertisements
-
Cumulative Frequency Distribution
- Shows the running total of frequencies up to a certain value or class.
- Can be used with both discrete and continuous data.
Advertisements
- Useful for determining percentiles, medians, and understanding data distribution over time or values.
- Example:
- Cumulative Distribution of Books Read (from Example 1)
Advertisements
| Number of Books | Frequency | Cumulative Frequency |
| 0 | 5 | 5 |
| 1 | 6 | 11 |
| 2 | 5 | 16 |
| 3 | 2 | 18 |
| 4 | 2 | 20 |
- This cumulative frequency distribution shows, for example, that 16 students read up to 2 books.