
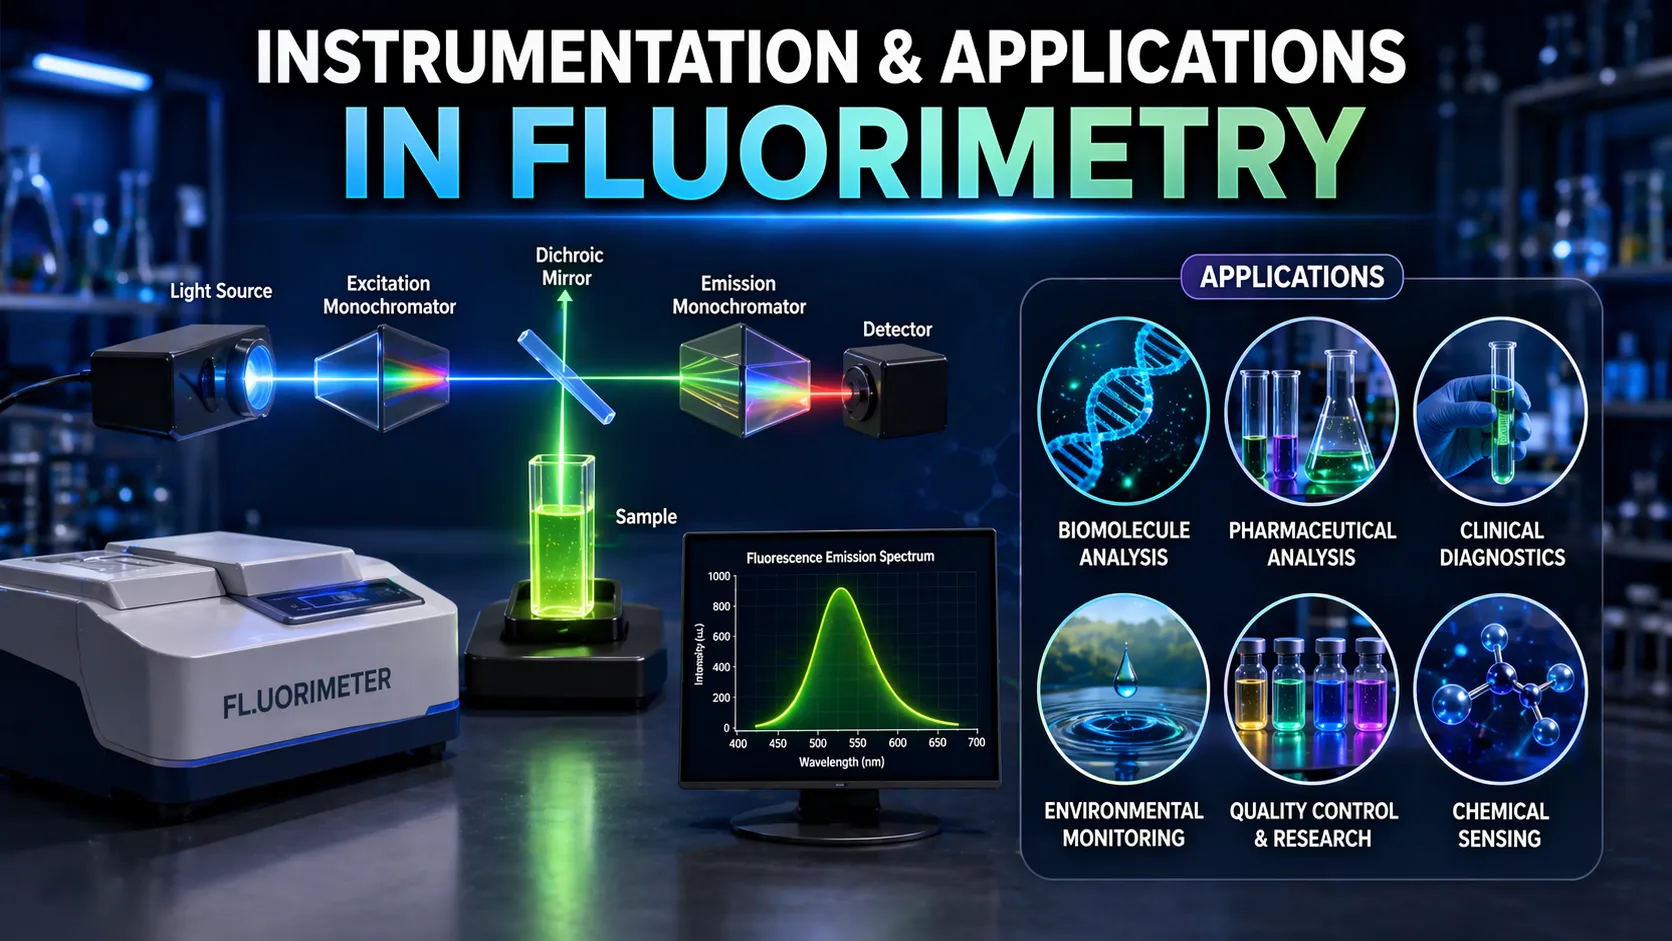
Instrumentation & Applications in Fluorimetry cover devices and uses for sensitive fluorescence-based analysis of compounds.
Instrumentation & Applications in Fluorimetry
- Fluorimeters are sophisticated instruments designed to measure fluorescence with high sensitivity and specificity.
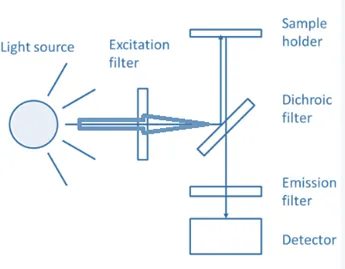
- The key components of a fluorimeter include the light source, excitation and emission monochromators or filters, sample holder, and detectors.
Advertisements
Components of a Fluorimeter
-
Light Source
- Xenon Arc Lamp
- Provides continuous spectrum from UV to visible regions.
- High intensity and stability.
- Mercury Vapor Lamp
- Emits intense lines at specific wavelengths.
- Suitable for fixed-wavelength excitation.
- Lasers
- Offer monochromatic and coherent light.
- Ideal for high-sensitivity applications.
- LEDs
- Energy-efficient and long-lasting.
- Available in various wavelengths.
- Xenon Arc Lamp
-
Excitation Monochromator
-
- Function: Selects the specific wavelength of light used to excite the sample.
- Types: Prisms or diffraction gratings.
-
-
Sample Holder
- Cuvettes
- Made of quartz (for UV range) or glass.
- Designed to minimize light scattering.
- Front-Face Sample Holders
- Used for solid or opaque samples.
- Excitation and emission are measured from the same side.
- Cuvettes
-
Emission Monochromator
- Function: Isolates the emitted fluorescence at specific wavelengths.
- Considerations: High resolution and stray light rejection are important.
-
Detectors
- Photomultiplier Tubes (PMTs)
- Extremely sensitive to low light levels.
- Fast response times.
- Charge-Coupled Devices (CCDs)
- Allow for simultaneous detection of multiple wavelengths.
- High quantum efficiency.
- Photomultiplier Tubes (PMTs)
-
Filters
- Bandpass Filters
- Transmit a specific wavelength range.
- Used to eliminate unwanted light.
- Cut-off Filters
- Block wavelengths below or above a certain threshold.
- Bandpass Filters
-
Data Processing System
- Computers and Software
- Control instrumental parameters.
- Collect and analyze data.
- Provide spectral displays and quantitative results.
- Computers and Software
Working of Fluorimetry
-
Excitation:
- A sample is illuminated with UV or visible light.
-
Absorption:
- Molecules in the sample absorb the light and become excited to a higher energy state.
-
Non-Radiative Relaxation:
- Some energy is lost through non-radiative processes, bringing the molecule to a lower vibrational level within the excited state.
-
Emission:
- Excited molecules return to the ground state, emitting light (fluorescence) of a longer wavelength than the excitation light due to energy loss.
-
Detection:
- A detector, placed at a right angle to the excitation beam, measures the intensity of the emitted fluorescence.
-
Spectral Analysis:
- Emission intensity is plotted against emission wavelength, providing qualitative and quantitative data about the sample.
-
Quantification:
- Fluorescence intensity is compared to calibration standards to determine the concentration of fluorescent species.
Applications of Fluorimetry
- Quantitative Analysis: Determines the concentration of fluorescent compounds.
- Molecular Dynamics: Studies molecular environments, interactions, and conformational changes.
- DNA Analysis: Uses fluorescent dyes for sequencing and detection.
- Clinical Diagnostics: Detects and quantifies biomolecules for disease diagnosis.
- Environmental Monitoring: Identifies pollutants in water, air, or soil.
- Drug Discovery: Examines drug interactions and properties.
- Cell Biology: Visualizes cellular processes using fluorescent dyes/proteins (e.g., GFP).
- Food Industry: Detects contaminants and measures compound concentrations.
Advertisements